Context
Daribar has an internal dashboard for operators - a plain React app, no Next.js, just CRA. It shows orders in real time: each order has a timer, a status, a bunch of data. At peak times, hundreds of orders on screen simultaneously.
The server was running under high load, the app felt a bit sluggish - but manageable. Nobody dug into it much: operators got used to it, the business lived with it. Every now and then someone added virtualization or optimized a render, things got slightly better, and everyone moved on.
Until user growth made "manageable" turn into "impossible to work with." That's when we actually had to figure it out. Turned out the main problem had nothing to do with the code.
Problem 1: the app had been running in the wrong mode for 3 years
The React app was deployed with yarn start. That's the dev server. It's built for development - slow, unoptimized, with hot reload and a lot of extra work happening under the hood.
In production, you should build the app and serve the static output via serve or nginx:
# Before (wrong)
yarn start

# After (correct)
yarn build
serve -s build
# or via nginx
The difference is massive. The dev server does on every request what a production build does once at build time. For three years the app was running in development mode in production - and nobody noticed, because everyone was looking at the code.
After switching to the correct deploy, the numbers speak for themselves:
- CPU: from 60-80% at peak down to 2-4%
- Memory: stabilized, stopped growing
- Server restarts: gone completely
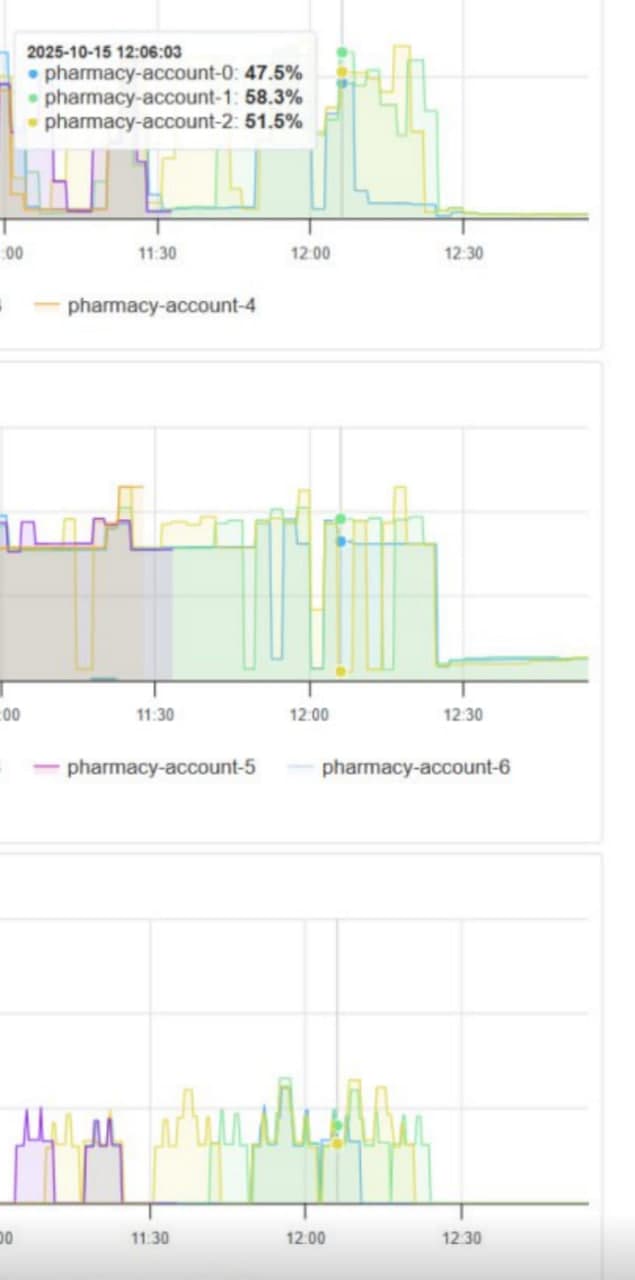
On the graphs you can see the exact moment of the switch - around 12:00. Before that: CPU jumping between 47-58%, unstable memory, periodic server restarts. After - flat and quiet.
The business saved on infrastructure. Operators stopped complaining about slowness. And all of this - from one change in the deploy command.
Lesson: before optimizing code - make sure the app is actually running correctly in the first place.
Problem 2: hundreds of timers recreating themselves every second
Each order in the dashboard has a timer showing how much time has passed. It looked something like this:
function OrderRow({ order }) {
  const [elapsed, setElapsed] = useState(0);

  useEffect(() => {
    const interval = setInterval(() => {
      setElapsed(Date.now() - order.createdAt);
    }, 1000);

    return () => clearInterval(interval);
  }, [order.createdAt]); // recreated every time order data changes

  return <div>{formatTime(elapsed)}</div>;
}
Looks fine at first glance. But when you have 200+ orders, each with its own setInterval that gets recreated on every data update - the browser starts burning a huge amount of resources just managing timers.
setInterval inside useEffect with dependencies is a trap. Every time a dependency changes, the old interval is cleared and a new one is created. With frequent data updates, the timer is basically restarting constantly.
Fix - useRef:
function OrderRow({ order }) {
  const [elapsed, setElapsed] = useState(0);
  const intervalRef = useRef(null);
  const startTimeRef = useRef(order.createdAt);

  useEffect(() => {
    // Create the interval once
    intervalRef.current = setInterval(() => {
      setElapsed(Date.now() - startTimeRef.current);
    }, 1000);

    return () => clearInterval(intervalRef.current);
  }, []); // empty array - interval is created once

  return <div>{formatTime(elapsed)}</div>;
}
useRef stores a value between renders without triggering the effect again. The interval is created once on mount and lives until unmount. The browser no longer wastes CPU constantly recreating hundreds of timers.
The difference was immediate - CPU in the browser stopped spiking, the UI became noticeably more responsive.
Problem 3: rendering hundreds of rows without virtualization
This was the problem everyone had been looking at from the start - and it was real, just not the only one.
When a table has 300+ orders and every row is a component with a timer, data, and buttons - the browser renders all of it at once. Even if the user only sees 20 rows on screen.
Virtualization fixes this: only visible rows are rendered, plus a small buffer. Everything else exists only as empty space in the DOM.
npm install react-windowimport { FixedSizeList } from 'react-window';
function OrderList({ orders }) {
return (
<FixedSizeList
height={600} // container height
itemCount={orders.length}
itemSize={60} // row height
width="100%"
>
{({ index, style }) => (
<div style={style}>
<OrderRow order={orders[index]} />
</div>
)}
</FixedSizeList>
);
}Instead of 300 components in the DOM - only 15-20 visible ones. The difference in memory usage and render speed is significant.
Takeaways
Three problems, three fixes - each one making a real difference:
Correct deploy mode - the biggest win. CPU dropped from 60-80% to 2-4%, server restarts disappeared, the business saved on infrastructure. Running a dev server in production is like driving with the handbrake on.
useRef for timers - eliminated the constant recreation of hundreds of intervals. The browser stopped burning CPU on timer management, the UI became smoother.
Virtualization - reduced DOM elements from hundreds to a few dozen. Especially noticeable on lower-end devices.
The main takeaway: for three years everyone just lived with the problem - until traffic growth forced us to actually look at it. And it turned out the root cause had nothing to do with the code, but with how the app was being run. That's not a criticism - it happens, especially when a project grows gradually and things are just "historically the way they are." But now the first thing I check when there's a performance issue is the basics: how is it running, what mode, what resources is it actually consuming.
Sometimes the simplest things have the biggest impact.